Guanajuato Weather
The weather chart below displays the average weather for Guanajuato, Mexico to help you to plan the best time of year to visit Guanajuato.
The first Guanajuato weather chart displays the average day time maximum temperature and the average number of wet days per month.
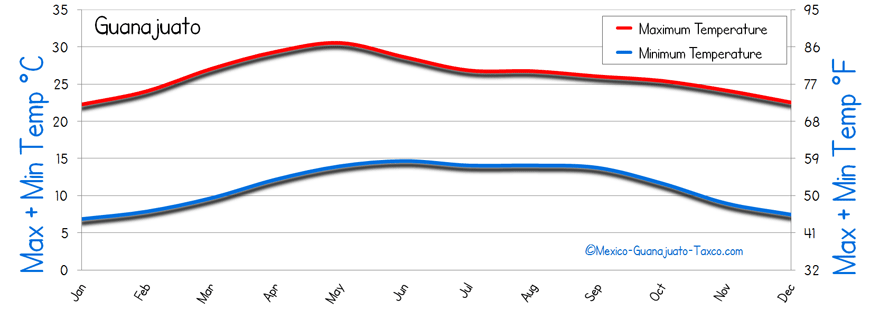
The second chart displays the average day time maximum temperature and night time minimum temperature in both Fahrenheit and centigrade.
Average Weather of Guanajuato

Guanajuato Temperature Chart in Centigrade and Fahrenheit
Guanajuato Maximum and Minimum Temperature

Guanajuato temperature in Fahrenheit and Centigrade
The day time maximum temperature measures the air temperature in shade therefore the temperature of Guanajuato will be much higher in direct sunlight.
Guanajuato Rainfal and Rain
The following two weather charts of Guanajuato display the average monthly summary for rainfall and sunshine. The first chart shows the total amount of rain plotted against the number of wet days.
The second chart plots the average hours of sun per day against the maximum temperature for Guanajuato.

Rainfall and number of wet days for Guanajuato
Guanajuato Sunshine & Hours of Sun

Sunshine and sun hours for Guanajuato
The above sunshine chart of Guanajuato shows the average number of hours of sun per day for Guanajuato, this is plotted against the day time maximum temperature. Guanajuato receives it's most sun during the spring months before the summer rains.
Guanajuato Mexico Tourist Guide Navigation


