GuanajuatoMexicoCity.com
The best independent guide to Mexico City
GuanajuatoMexicoCity.com
The best independent guide to Mexico City
Mexico City Weather
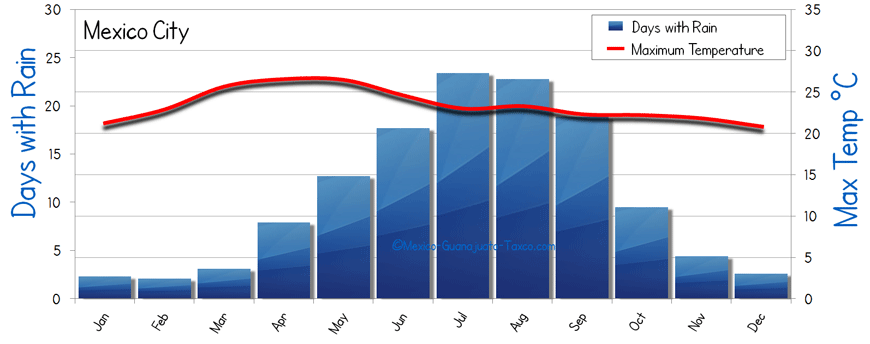
The weather chart below displays the overview of the average weather conditions of Mexico City. The weather chart displays the maximum day time temperature plotted against the average number of wet days per month. The chart indicates that the early summer months are warmer but this is the time of the year when most of the rain falls. The best of time the year to visit Mexico city is either in the early summer months or later in autumn. The summer months can become very oppressive with the high levels of pollution.
Mexico City Average Weather

Average weather for Mexico City
Mexico City Temperature
The following weather chart displays the average day time maximum temperature and the night time minimum temperature for Mexico City. The temperature charts of Mexico City displays the measurements in both Fahrenheit and Centigrade. The average day time maximum temperature of Mexico City does not alter significantly during the year, the hottest months are in the spring while the coldest months are in the winter. Visitors who are heading to Mexico City during the winter should pack warm clothes as the evenings can be surprisingly cold.

Mexico City temperature in Fahrenheit and Centigrade
The day time maximum temperature measures the air temperature in shade therefore the temperature of Mexico City will be much higher in direct sun light.
Mexico City Sunshine and Hours of Sun
The following weather chart indicates the average number of hours of sunshine per day averaged over the entire year for Mexico City. The average hours of sun is plotted against the day time maximum temperature of Mexico City. As Mexico City suffers with extreme pollution the sun maybe technically shining but the intensity is reduced by the ever present smog that covers the city. The spring months have both the highest temperatures and most hours of sun light. Both the sunshine hours and maximum temperature for Mexico City are significantly less than on the coast or to the north of the country.

Sunshine and sun hours for Mexico City
Mexico City Rainfall Rain
The weather chart below displays the number of wet days (bar chart) that Mexico City experiences. This is plotted against the total amount of rain, in mm, that falls over the capital. Mexico City has two distinctive seasons; a wet and dry season - most of the rain falls during the summer month wet season. This wet season is not a good time to visit Mexico City while the spring months are the best.

Average Rainfall for Mexico City
A wet day is defined as a day in which at least 0.1mm of rain falls within. Typically the winter months have almost no rain while all of the rain of Mexico City falls during the summer. This does bring relief to the high levels of pollution.


